
You’ve probably seen those colorful Core Web Vitals scores in Google’s PageSpeed Insights or Search Console. Green means good, red means bad… simple, right? But those numbers only scratch the surface.
What really happens when a user visits your site? How quickly does your most important content appear? Does your layout shift unexpectedly? Can users interact without delays, even on older devices?
If you're serious about technical SEO and performance, these questions aren’t optional. They are mission critical.
Take this example: two websites both show a 90+ performance score. But one still feels poor to users. Why? Because it’s not just about scores, it’s about what’s measured, how it’s measured, and what you do with that data.
That is where this guide steps in.
We are going beyond the basics. No fluff, no vague tips. Just a solid, technical walkthrough of how Core Web Vitals really work under the hood, how you can measure them accurately, and what you can do to fix issues that actually matter.
This guide will help you truly understand, debug, and improve your site’s Core Web Vitals step by step, with real technical insights.
What Exactly Are Core Web Vitals?
Core Web Vitals are a set of three user-focused performance metrics defined by Google that measure how fast, interactive, and visually stable your website feels to real users.
They are part of Google's broader Web Vitals initiative, but these three are critical, because they directly influence user experience and your search visibility.
Now, you might be wondering why just these three? Because they each represent a key moment in the user’s journey: when the page loads, when they interact, and whether the layout behaves nicely or jumps around unexpectedly.
Let’s break them down in a way that actually makes sense when you’re staring at your dev console or Lighthouse report.
1. Largest Contentful Paint (LCP)
LCP measures how long it takes for the biggest content element (usually an image or block of text) to become visible on the screen.
But it's not just about server speed or time to first byte. LCP tracks perceived load speed, meaning what the user feels is loaded, not just what the browser says is.
If your hero image main heading, or top product block takes too long to appear, your LCP score suffers, even if the rest of the page is lightning fast.
2. Interaction to Next Paint (INP)
This one replaced FID (First Input Delay), and for good reason.
INP measures how quickly your page responds to any user interaction throughout the session, not just the first one. It checks how long the browser takes from when someone taps, clicks, or types to when the next frame visibly changes.
In short, if your page feels laggy, INP will expose it. This is where long JavaScript tasks and event handling bottlenecks show up loud and clear.
3. Cumulative Layout Shift (CLS)
CLS looks at how much your page jumps around while loading. You’ve probably experienced that annoying shift when you go to click a button, and it moves at the last second because something else is loaded.
That’s CLS in action. It tracks unexpected layout shifts, and punishes them in your score.
The good news is that it's not hard to fix if you start reserving space for images, fonts, and embeds properly. But if ignored, it kills the perceived quality of your page, even if your LCP and INP are great.
Why Do Core Web Vitals Matter ?
Core Web Vitals matter because they directly impact how your users experience your website, not just how Google ranks it.
Let’s break it down.
So, when someone lands on your site, they don’t just care whether it shows up on the first page. They care about how fast it loads, how quickly it reacts when they tap or click, and whether the layout jumps around unexpectedly as it loads. These are exactly the kinds of pain points Core Web Vitals are designed to track and fix.
Yes, Google uses Core Web Vitals as search ranking signals. But that’s not the full story. These metrics are experience metrics. They tell you whether users are having a smooth and frustration-free interaction with your site.
If your site scores poorly on these, chances are users are:
- Bouncing off before the page even finishes loading,
- Getting annoyed by lags when interacting,
- Or abandoning forms and carts due to layout shifts or slow responses.
All of this leads to lower conversions, fewer repeat visits, and a higher cost per acquisition.
From a business standpoint, optimizing Core Web Vitals means better UX. That leads to higher engagement, longer sessions, and improved revenue metrics.
From a developer's standpoint, they offer a clear technical roadmap to improve frontend performance without guessing.
From a product standpoint, good Web Vitals mean you’re building something your users actually enjoy using. And that is ultimately the goal, right?
So yes, while they do affect SEO, the real value of Core Web Vitals is in building a faster, cleaner, and more trustworthy user experience.
How to Find an Overview of Your Site’s Google Core Web Vitals Metrics
To find an overview of your site’s Google Core Web Vitals metrics, start by looking at the Core Web Vitals report inside Google Search Console. It gives you a high‑level, real‑user metric summary across your whole domain.
When you log in to Google Search Console and select your verified property, go to the “Experience” > “Core Web Vitals” section.
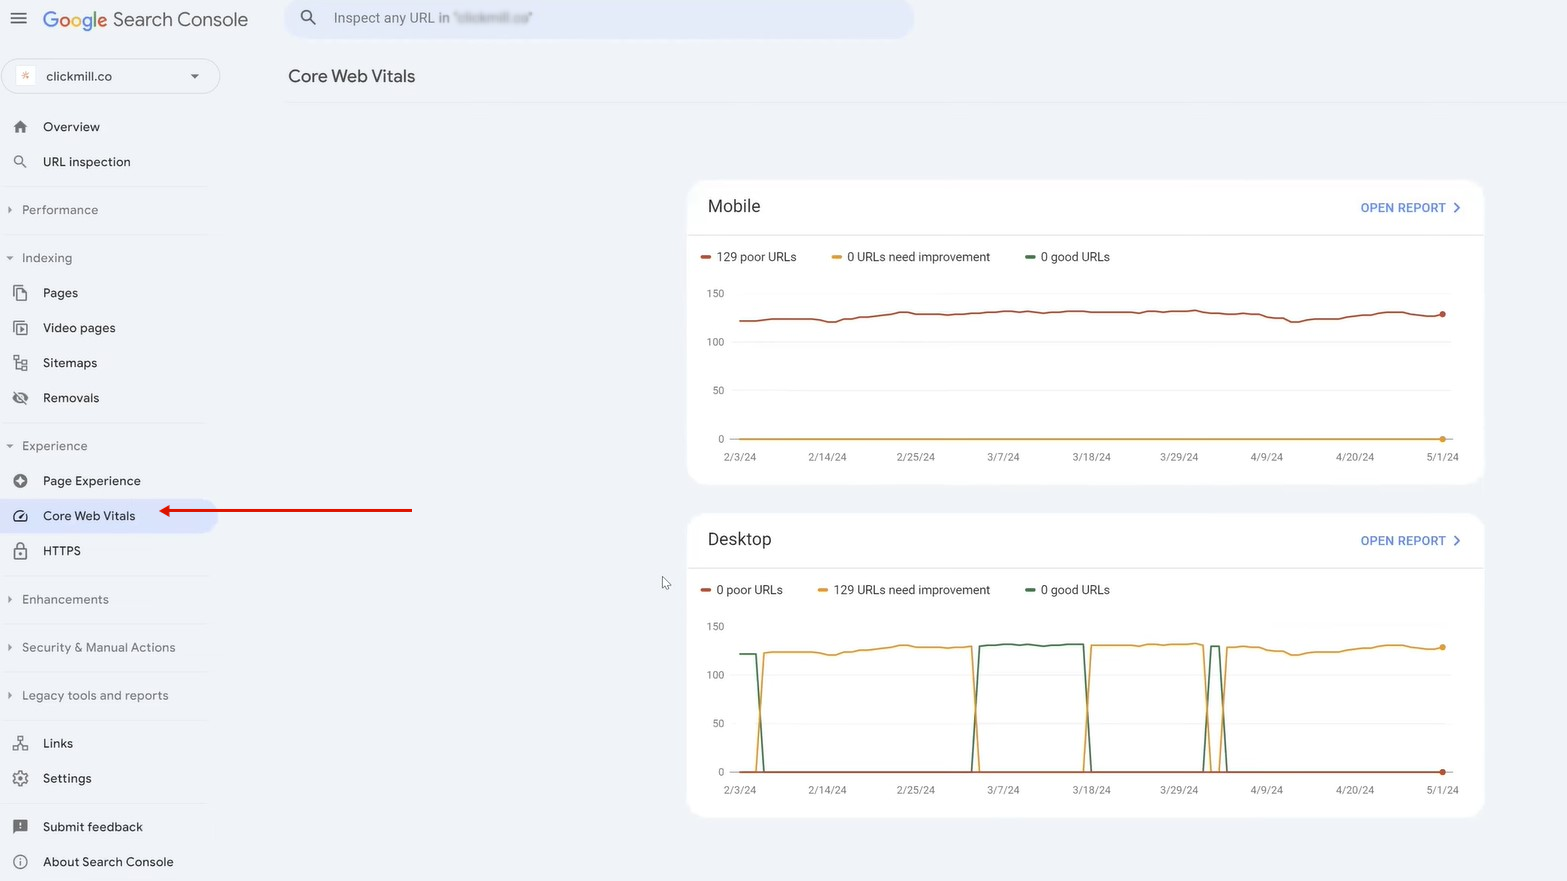
Here you’ll see a clear chart showing how many of your URLs fall into Good, Needs Improvement, or Poor categories for the three key metrics: LCP (loading), INP (interactivity), and CLS (visual stability).
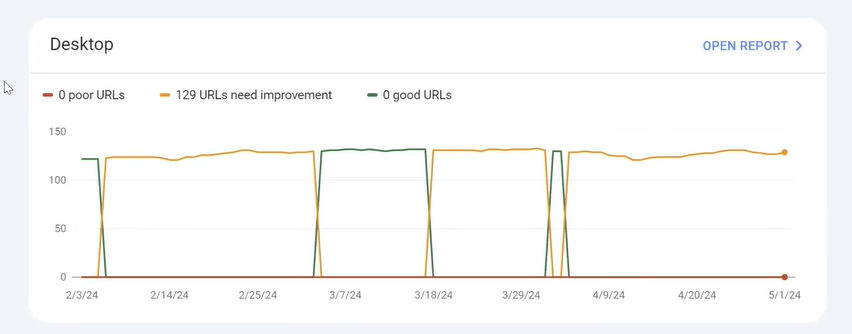
This overview helps you answer big questions quickly, like how many pages need improvement and which metric is dragging down your overall experience rating.
If you want page‑level detail, click into the report to view specific groups of URLs with similar performance issues. Use the links to tools like PageSpeed Insights to dig deeper into individual pages.
Pro tip: PageSpeed Insights is another quick way to check Core Web Vitals for a specific URL. Just enter the page’s address and click Analyze. It shows both real‑world (field) data and lab diagnostics for each metric so you can understand how users experience that page right now. |
How to Fix LCP, INP, and CLS the Right Way
The quickest way to fix LCP is to optimize and prioritize the loading of your largest visible content, usually a hero image, heading, or banner. You need to ensure that this content shows up as early as possible without getting delayed by unnecessary scripts, fonts, or render-blocking styles.
Let’s break that down with real solutions you can apply right away.
How to Fix LCP (Largest Contentful Paint)
To fix LCP, your goal is simple: make the biggest visible element on your page load as quickly as possible. Usually, it’s a large image, video, or a block of text that appears above the fold.
To improve it, you need to optimize what loads first, how it loads, and when it loads. At the same time, make sure nothing blocks the user from seeing the main content.
1. Preload the LCP Element
If your LCP is an image or font, tell the browser early. Add a <link rel="preload"> tag in the <head> to load that image or asset as a priority.
<link rel="preload" as="image" href="/hero.jpg">
You’re giving the browser a heads-up: “this is important, load it now.”
2. Remove Render-Blocking Resources
Every CSS file or JavaScript file in your <head> is like a traffic signal. The browser stops reading it, even if it’s not immediately useful.
Use:
- defer for JavaScript that’s not critical
- media="print" for non-visible stylesheets
Also consider inlining critical CSS, just the part needed for above-the-fold content.
3. Use a Fast Server and CDN
Slow server response delays everything. If your Time to First Byte (TTFB) is high, LCP takes a hit.
Switch to a performant hosting solution or enable caching and use a CDN to serve assets closer to the user.
4. Compress and Optimize Images
Use modern formats like WebP or AVIF, compress image sizes without losing clarity, and always specify width and height.
This reduces the time it takes for the browser to render the element, especially important if the LCP is a hero image or video thumbnail.
5. Prioritize Visible Content
Don’t let ads, pop-ups, or lazy-loaded scripts delay your main content. The browser should paint the meaningful part of your UI first.
Audit what loads in the first 2.5 seconds. If the LCP element isn’t visible by then, it’s too late.
Bonus Tip: Use Chrome DevTools. In the Performance tab, record a load and look for the purple “LCP” marker. This tells you exactly which element is being tracked. |
How to Fix INP (Interaction to Next Paint)
To fix INP, you need to reduce the delay between a user's interaction (like a tap or click) and the visual feedback on screen. That means identifying what’s blocking the main thread and removing, deferring, or optimizing those tasks.
INP issues are usually caused by long JavaScript tasks, inefficient input handling, or heavy UI updates after user actions.
Let’s break down.
1. Break Long Tasks into Smaller Chunks
When JavaScript tasks take longer than 50 milliseconds, your page starts to feel sluggish. The browser can't respond to user actions until those tasks are done.
Use Chrome DevTools (Performance tab) to spot these long tasks. Once found, break them up using setTimeout(), requestIdleCallback(), or even Web Workers if they're really heavy.
This gives the browser breathing room to respond quickly when users tap or scroll.
2. Optimize Input Handlers:
Some websites attach bloated event listeners to clicks, touches, or keypresses. These handlers might be running expensive logic like DOM manipulation, network calls, or analytics before showing any visual feedback.
Instead, give the user a quick UI response first and defer heavy work. Move non-essential logic outside the input handler using requestAnimationFrame() or promises.
That way, the interaction feels instant even if extra work is queued right after.
3. Minimize Layout Thrashing:
Layout thrashing happens when your code reads and writes styles repeatedly, triggering reflows that delay rendering.
Let’s say you read an element’s width and immediately change its height, then repeat this in a loop. That’s layout thrashing. It forces the browser to recalculate layouts constantly.
The fix is to batch your DOM reads and writes separately and avoid unnecessary reflows.
4. Defer Non-Critical JavaScript:
If your site loads everything upfront, chances are you’re delaying first interactions. INP doesn’t just care about page load. It cares about any interaction, even later.
Use code splitting (with tools like Webpack or Vite) and lazy-load features that aren't immediately needed.
This ensures that the browser stays free to process input when the user needs it, rather than getting stuck parsing features they’ll never use.
5. Preload Key Assets
Sometimes the delay comes from missing assets like fonts, icons, or images that get fetched after a user taps something.
If something's needed for interaction (like a modal icon), preload it using: <link rel="preload" href="/icons/close.svg" as="image">
It’s a small step, but it removes one more reason for the browser to pause.
How to Fix CLS (Cumulative Layout Shift)
To fix CLS, you need to stop unexpected shifts in your layout by pre-defining space for every visual element before it loads. That means setting dimensions for images and videos, reserving areas for ads or banners, and preventing fonts from loading in ways that cause layout jumps.
These small changes can drastically improve how smooth and stable your page feels to real users.
Let’s break it down step by step.
1. Always Set Width and Height for Images/Videos
This is the most common cause of layout shift. An image appears after the rest of the content and pushes everything down.
So what do you do?
Add fixed dimensions in HTML or CSS. For example:
<img src="product.jpg" width="600" height="400" alt="Product">
Or, if you're using CSS, maintain aspect ratio with:
aspect-ratio: 3 / 2;
This tells the browser to reserve space, even before the image loads.
2. Reserve Space for Dynamic Content
You know those cookie banners, newsletter popups, or live chat widgets that show up out of nowhere?
Always give them reserved space using empty containers or placeholder divs. That way, when they load, they don't push the rest of the content around.
.minibar-placeholder {
height: 50px;
}
Place this before your actual script loads. It's a simple fix that saves your CLS score.
3. Handle Web Fonts Smoothly
When fonts load too slowly or replace system fonts mid-render, you get a flash of invisible or unstyled text. That causes CLS.
To fix it:
- Use font-display: swap; in your @font-face rules.
- Preload your fonts and preconnect to font CDNs:
<link rel="preconnect" href="https://fonts.gstatic.com" crossorigin>
<link rel="preload" as="font" href="font.woff2" type="font/woff2" crossorigin>
This keeps layout consistent and avoids jumps when fonts kick in.
4. Avoid Injecting Content Above Existing Elements
Adding banners, alerts, or notifications above the fold without reserved space pushes everything below and causes a shift.
Instead of injecting new content at the top, consider pushing it below or using modals or fixed layers that don’t alter the flow.
Why Your Core Web Vitals Are Failing (Even with Good Scores)
When you start digging deeper into Core Web Vitals, you’ll quickly notice that not all performance data behaves the same. That’s because there are two big categories of data you’ll encounter: lab data and field data. They can tell very different stories about your site performance.
Here’s how to think about them in a way that actually makes sense when you’re trying to diagnose real problems.
Why Lab Data vs Field Data Matters?
Lab data is generated in a controlled test environment. It’s synthetic testing, like Google Lighthouse or PageSpeed Insights running a simulation of your page load. This gives you repeatable, consistent numbers, which are great for debugging.
But lab data doesn’t always reflect what real people experience when they hit your page. That’s where field data comes in. It’s collected from real user visits and shows you how your site actually performs in the wild.
This mismatch can be confusing. You might see perfect scores in lab tests, but your field data shows slow experiences for users. That’s not a bug. It's reality. Understanding that difference is one of the first advanced diagnostic skills you need.
Use the Right Tool for the Right Job
Use lab data to find bottlenecks, and use field data to measure impact.
Lab data tells you what could be wrong under controlled conditions. But field data is like customer feedback. It tells you what actually feels slow or unstable for users on real networks with real devices.
That means running Lighthouse or PageSpeed to spot render blocking resources or JavaScript bottlenecks is useful, but you shouldn’t only chase those numbers if your field scores (like in Search Console or CrUX) are telling you users are struggling.
Total Blocking Time: A Clue, Not the Whole Story
You’ll hear about metrics like Total Blocking Time (TBT) in lab reports. It’s not one of the Core Web Vitals, but it’s a great indicator for responsiveness issues that could be hurting your INP.
Why?
Because TBT measures how long the main browser thread is blocked by long tasks, and long tasks often mean slower responsiveness in real interactions. If your TBT is high, that’s a strong signal you need to break up long JavaScript execution or defer non critical scripts.
But remember: TBT is a lab metric, not the actual responsiveness metric Google uses in the field. So you use it as a diagnostic clue, not as the final answer.
Field Data Limitations
Field data comes from the Chrome User Experience Report (CrUX), but not every URL will have enough real user visits to generate field data. When that happens, tools may fall back on lab data or origin summaries.
That means if you’re testing a new page or a low traffic page, you might not see field scores yet. And that’s okay. It just means you have to rely on lab tests for now and then validate your changes once enough real world visits happen.
Common pitfalls you’ll actually see:
Fake “Perfect” Lab Scores
A PageSpeed Insight report can show green lights in the lab, but that doesn’t guarantee users have a fast experience, especially if your real user field data is below thresholds.
This happens when tests cheat the timeline, like delaying JS execution, that real users wouldn’t tolerate.
- Over Optimizing for a Test, Not Real Users
If you make changes just to please a lab test, you might actually make the user experience worse. That’s because lab metrics can be gamed, while field metrics reflect actual interaction delays and layout shifts.
Ignoring Device and Network Variability
Real users come from all over with different devices and connections. A controlled lab test can’t simulate every scenario, so field data often reveals performance gaps you didn’t expect.
Final Thought
At the end of the day, Core Web Vitals aren’t just numbers to chase. They’re signals from your users. If your site loads slow, feels clunky, or jumps around, you’ll feel it in your bounce rates, not just your PageSpeed scores.
Focus on real-world performance, not just lab tests.
Measure, test, tweak, and repeat. Prioritize the experience, not just the metrics.
And remember, Google rewards usable sites, not just fast ones.
So if you’ve made it this far, you’re already ahead of the curve. Now take the next step and put this knowledge into action.
Because better vitals don’t just help rankings. They help people stay.
And that’s what really matters.
Frequently Asked Questions (FAQs)
1. What’s the difference between Core Web Vitals field data and lab data?
Field data comes from real users visiting your site and reflects real world experience. Lab data is a controlled simulation used for debugging but may not match real user conditions.
2. Why do my Core Web Vitals scores change over time?
Scores can fluctuate because real world factors like server responses and network conditions vary, and Google updates its data periodically based on fresh user experiences.
3. How many pageviews are needed for a Core Web Vitals score to show?
A site usually needs a certain amount of real user traffic before a reliable Core Web Vitals score appears, otherwise data may be too limited to report.
4. Can improving Core Web Vitals help beyond SEO?
Yes. Better vitals improve user experience, making your pages feel smoother, faster, and more stable, which can reduce bounces and increase engagement.
5. Do all three Core Web Vitals need to be good to impact SEO?
Ideally yes. Google evaluates LCP, INP, and CLS together, and a balanced improvement across all three gives the strongest real user experience signal.